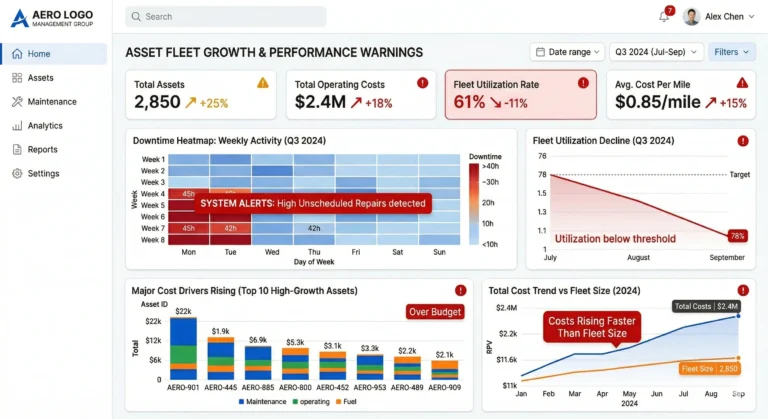
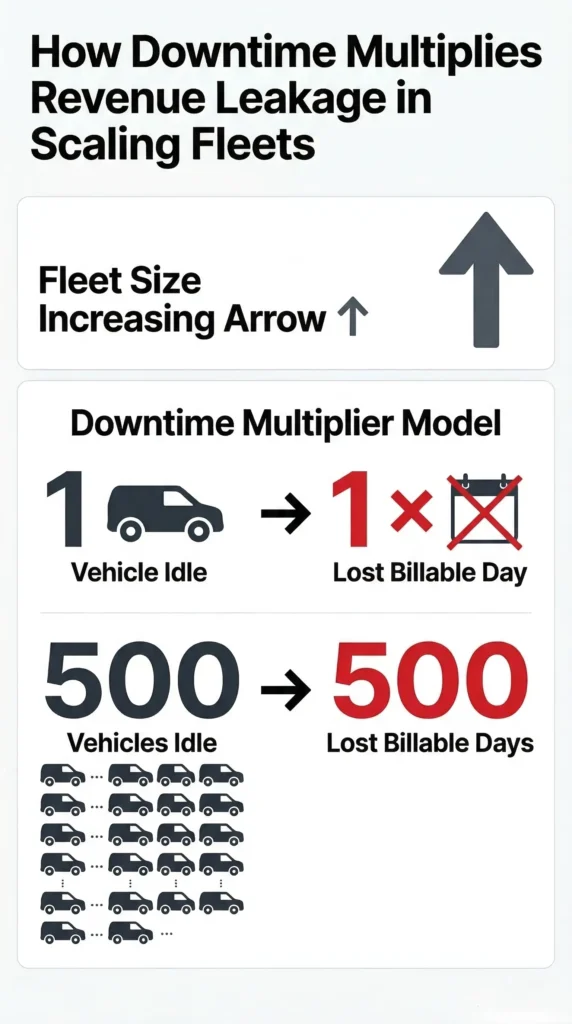
Downtime multiplies revenue leakage in scaling fleets because every additional vehicle increases exposure to repair cycles, coordination delays, and idle-day accumulation. While fleet size grows, unmanaged downtime compounds revenue loss across hundreds of assets. Critically, downtime is not an isolated loss—it scales with fleet size, amplifying both direct and indirect financial impacts across the entire operation.
Downtime as a Revenue Multiplier
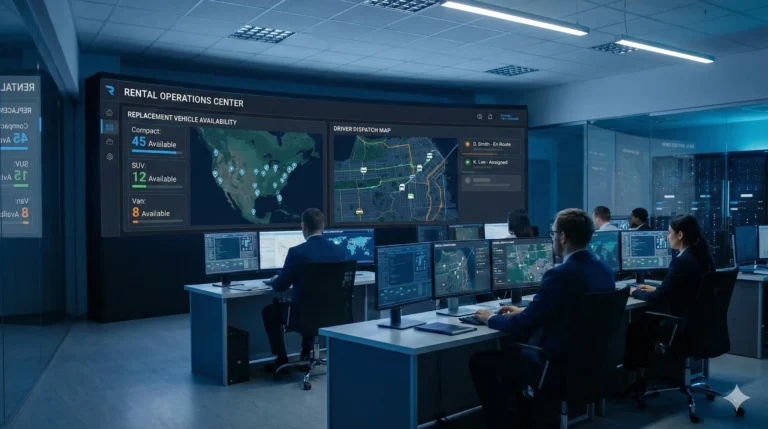
Every minute a vehicle is off-road removes billable capacity from your fleet. As you scale, each additional vehicle introduces a new node of potential revenue loss. When a unit undergoes repairs, it not only ceases to generate income but also triggers downstream effects:
- Replacement allocation absorbs additional capacity: Substitute vehicles must fill the gap, often requiring premium units or suboptimal assets, which further strains operational balance.
- Repair cost continues during idle time: Costs accrue even as assets remain unused, quietly eroding profits.
At scale, these effects multiply. For example, a fleet of 1,000 vehicles with a 5% downtime rate loses 50 units of billable days—each day. Multiply this across months, and the revenue impact balloons. The larger the fleet, the greater the exposure to simultaneous downtime events, intensifying the leakage effect.
Repair Cycle Instability During Expansion
As fleets grow, so do the complexities of the repair cycle. Key factors drive cycle instability:
- Approval delays: As the volume of repairs increases, bottlenecks in management or finance can slow down essential approvals.
- Insurance lag: Larger fleets mean more insurance claims, often managed by disparate teams. Resolution times lengthen as paperwork and verification processes pile up.
- Parts coordination: Sourcing and logistics become more complicated, especially when different makes and models are involved.
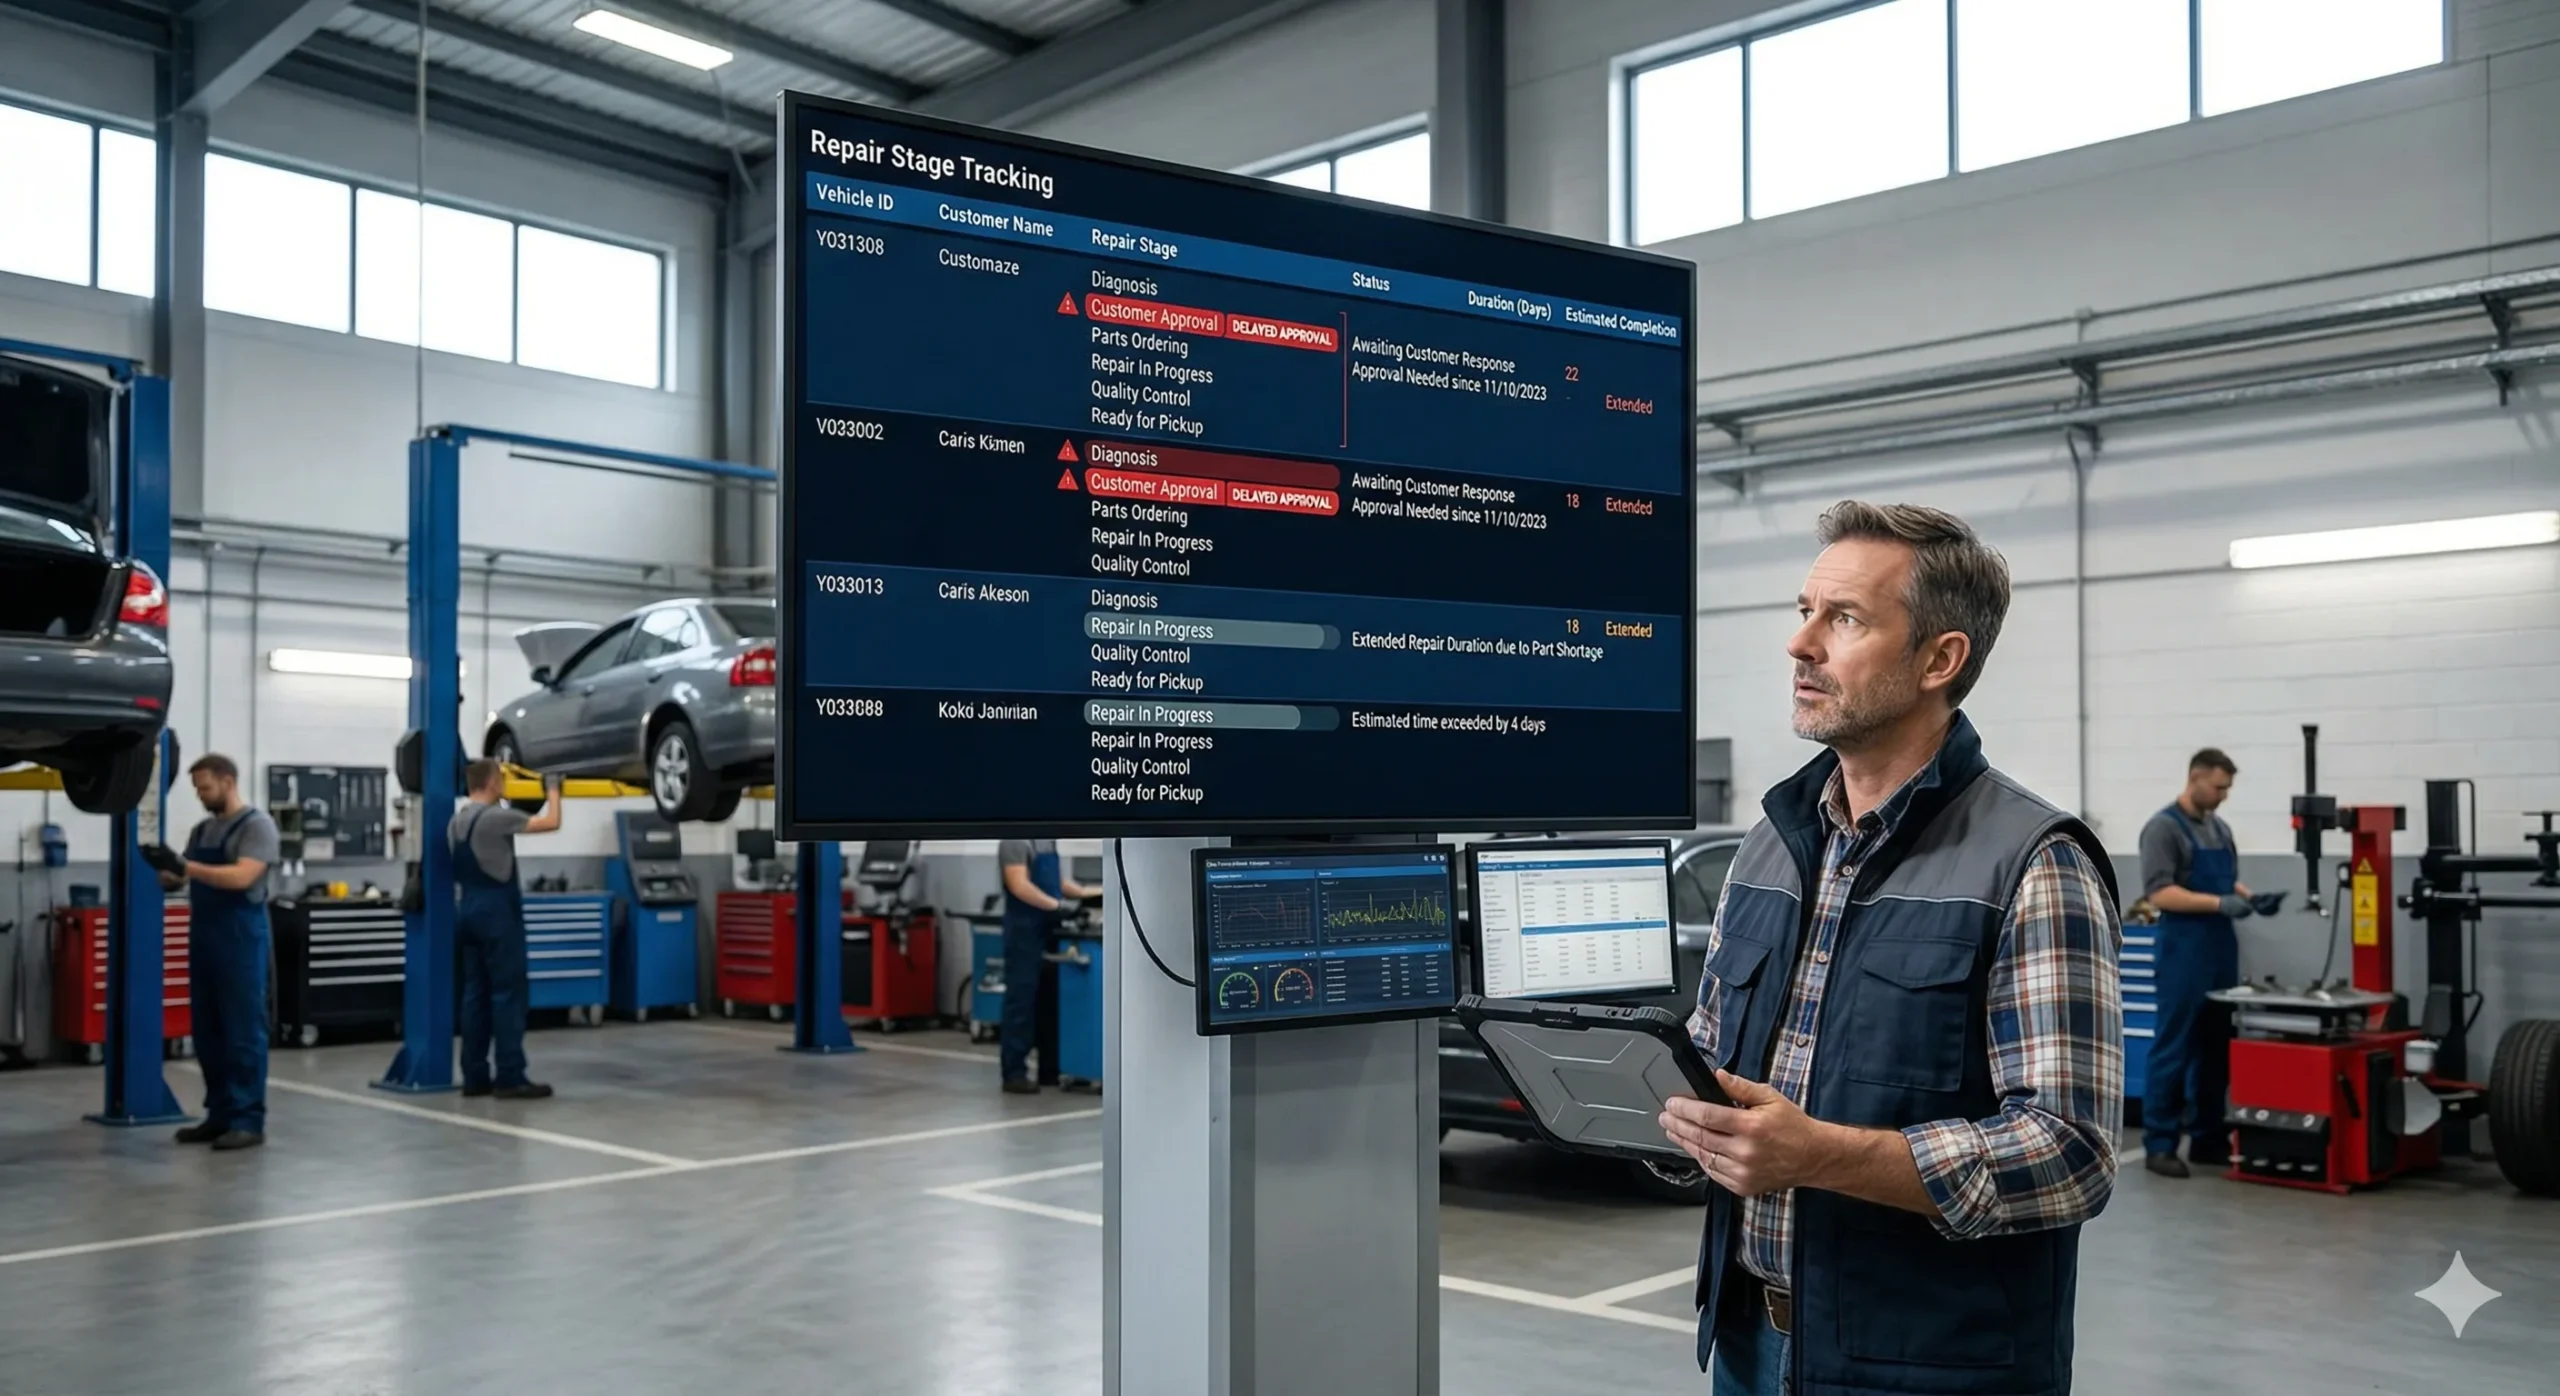
- No stage-based tracking: Without real-time visibility into each repair stage, vehicles languish in workshops, awaiting the next action.
- Unclear ready dates: Poor communication between workshops, fleet managers, and operators leads to uncertainty and missed revenue opportunities.
As coordination density increases, so does downtime duration. Each additional touchpoint lengthens the chain, compounding delays and multiplying revenue leakage as more vehicles become trapped in elongated repair cycles.
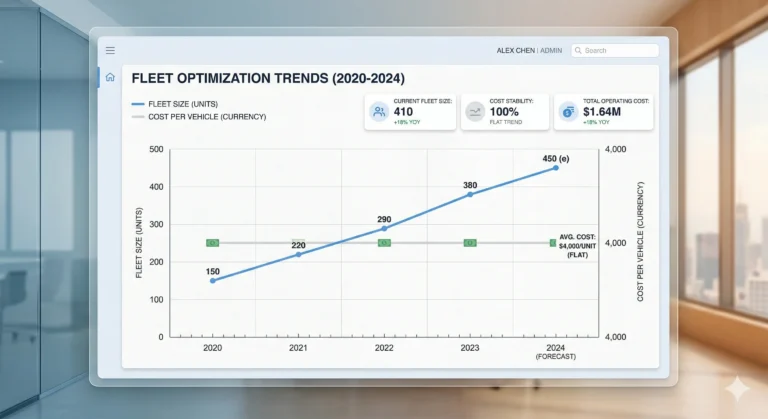
Idle Days & Revenue Per Vehicle Decline
Revenue Per Vehicle (RPV) is a direct function of utilization, rate, and time:
Revenue Per Vehicle = Utilization × Rate × Time
Downtime directly undercuts utilization. Every idle day is a day of lost earning potential. As a result, RPV erodes, especially in scaling fleets where the absolute number of idle days accumulates rapidly. For example, a 1% increase in idle days across a 500-vehicle fleet translates to hundreds of lost billable days per month. This rapid accumulation compresses both RPV and overall fleet profitability.
Moreover, as utilization dips, fixed costs per vehicle remain unchanged, further diluting margins. During periods of growth, the impact is magnified—fleet owners not only miss out on incremental revenue but also experience deepening cost compounding as idle vehicles stack up.
Replacement Duration & Dual Leakage
Replacement planning often falls short during rapid expansion. When replacement duration is unmonitored, the following problems arise:
- Premium vehicles misallocated: High-value assets are pulled into everyday roles, reducing their availability for higher-margin jobs and increasing wear.
- No forecasting: Without predictive analytics, fleet operators struggle to anticipate replacement needs, leading to last-minute scrambles and prolonged downtime.
This creates a dual leakage scenario: lost revenue from the original vehicle and suboptimal use of the replacement. When multiplied across a scaling fleet, the dual leakage effect becomes a significant source of margin compression.
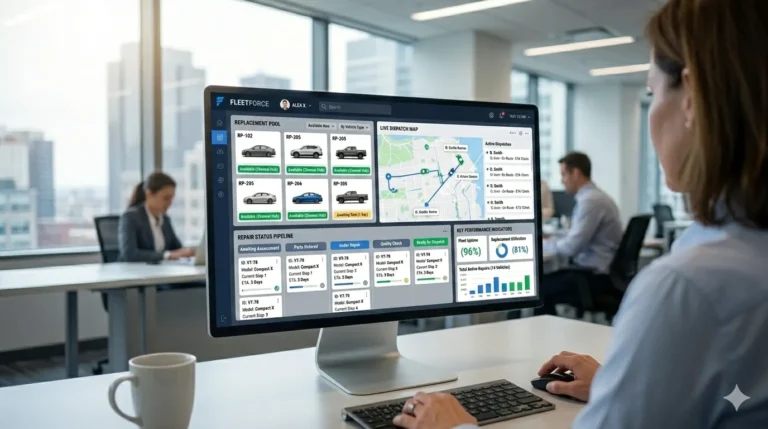
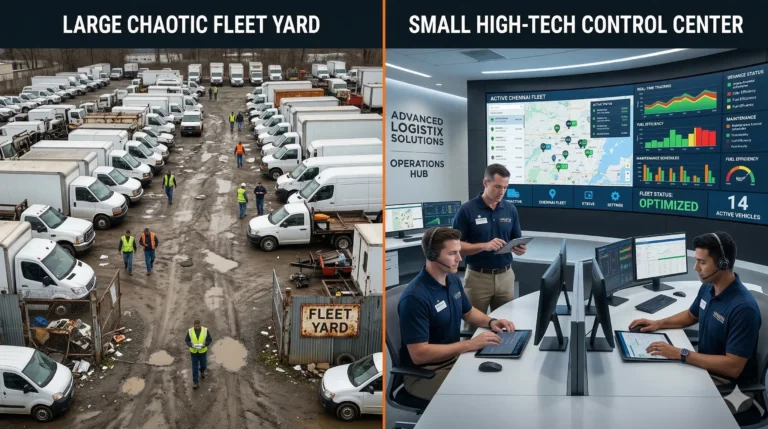
Structural Downtime Compression Strategy
To counteract the multiplier effect of downtime, fleets must adopt a structural approach:
- Automated intake routing: Streamlining the entry of vehicles into the repair pipeline reduces manual bottlenecks and accelerates initial response.
- Workshop stage transparency: Real-time tracking of each repair stage ensures accountability and prevents vehicles from being forgotten in the process.
- Repair forecasting: Leveraging data to predict repair needs minimizes surprises and aligns resources proactively.
- Replacement KPI tracking: Monitoring key performance indicators for replacements prevents premium asset misallocation and shortens replacement cycles.
- Real-time downtime heatmaps: Visualizing downtime by asset, location, and stage enables rapid intervention where it matters most.
- Margin-per-asset dashboards: Centralized financial tracking reveals where downtime impacts profit, empowering data-driven decisions.
Centralized synchronization across intake, repair, and replacement stages stabilizes downtime, protects RPV, and preserves margin during fleet growth.
FAQ
Downtime rises because more vehicles, repair events, and coordination points strain existing workflows. Approvals, parts, and resource allocation become more complex, extending the off-road period for each asset.
Downtime reduces utilization, directly shrinking Revenue Per Vehicle. Fixed costs remain, but billable days decline, compressing margins and eroding profitability.
Every additional vehicle increases the probability of simultaneous downtime events. Each off-road asset triggers lost revenue, replacement inefficiency, and cost compounding—scaling the impact across the fleet.
Efficient replacement planning minimizes the revenue gap caused by off-road vehicles. Poor planning leads to premium asset misallocation and extended idle periods, deepening revenue leakage.
Critical KPIs include average repair cycle time, idle days per asset, replacement duration, RPV, and margin-per-asset. Tracking these indicators highlights where downtime risk is growing.
Conclusion
Downtime multiplies revenue leakage in scaling fleets because expansion magnifies repair cycle instability and idle accumulation. Companies that compress downtime protect utilization and margin stability during growth.
Control downtime. Protect revenue. Then scale.