The profitability gap between growing fleets and mature fleets does not result from fleet size alone; instead, it emerges from operational design maturity. While growing fleets increase vehicle count, mature fleets increase revenue per vehicle and stabilize cost per asset. For fleet owners, COOs, CFOs, and investors, understanding this gap is key to transforming scale into sustainable, predictable profit. Operational maturity—not mere volume—ultimately determines margin density.
Revenue Per Vehicle: The Hidden Divider
Revenue per vehicle (RPV) is the foundational metric that separates high-performing fleets from those simply growing in size. In essence:
Revenue Per Vehicle = Utilization × Rate × Time
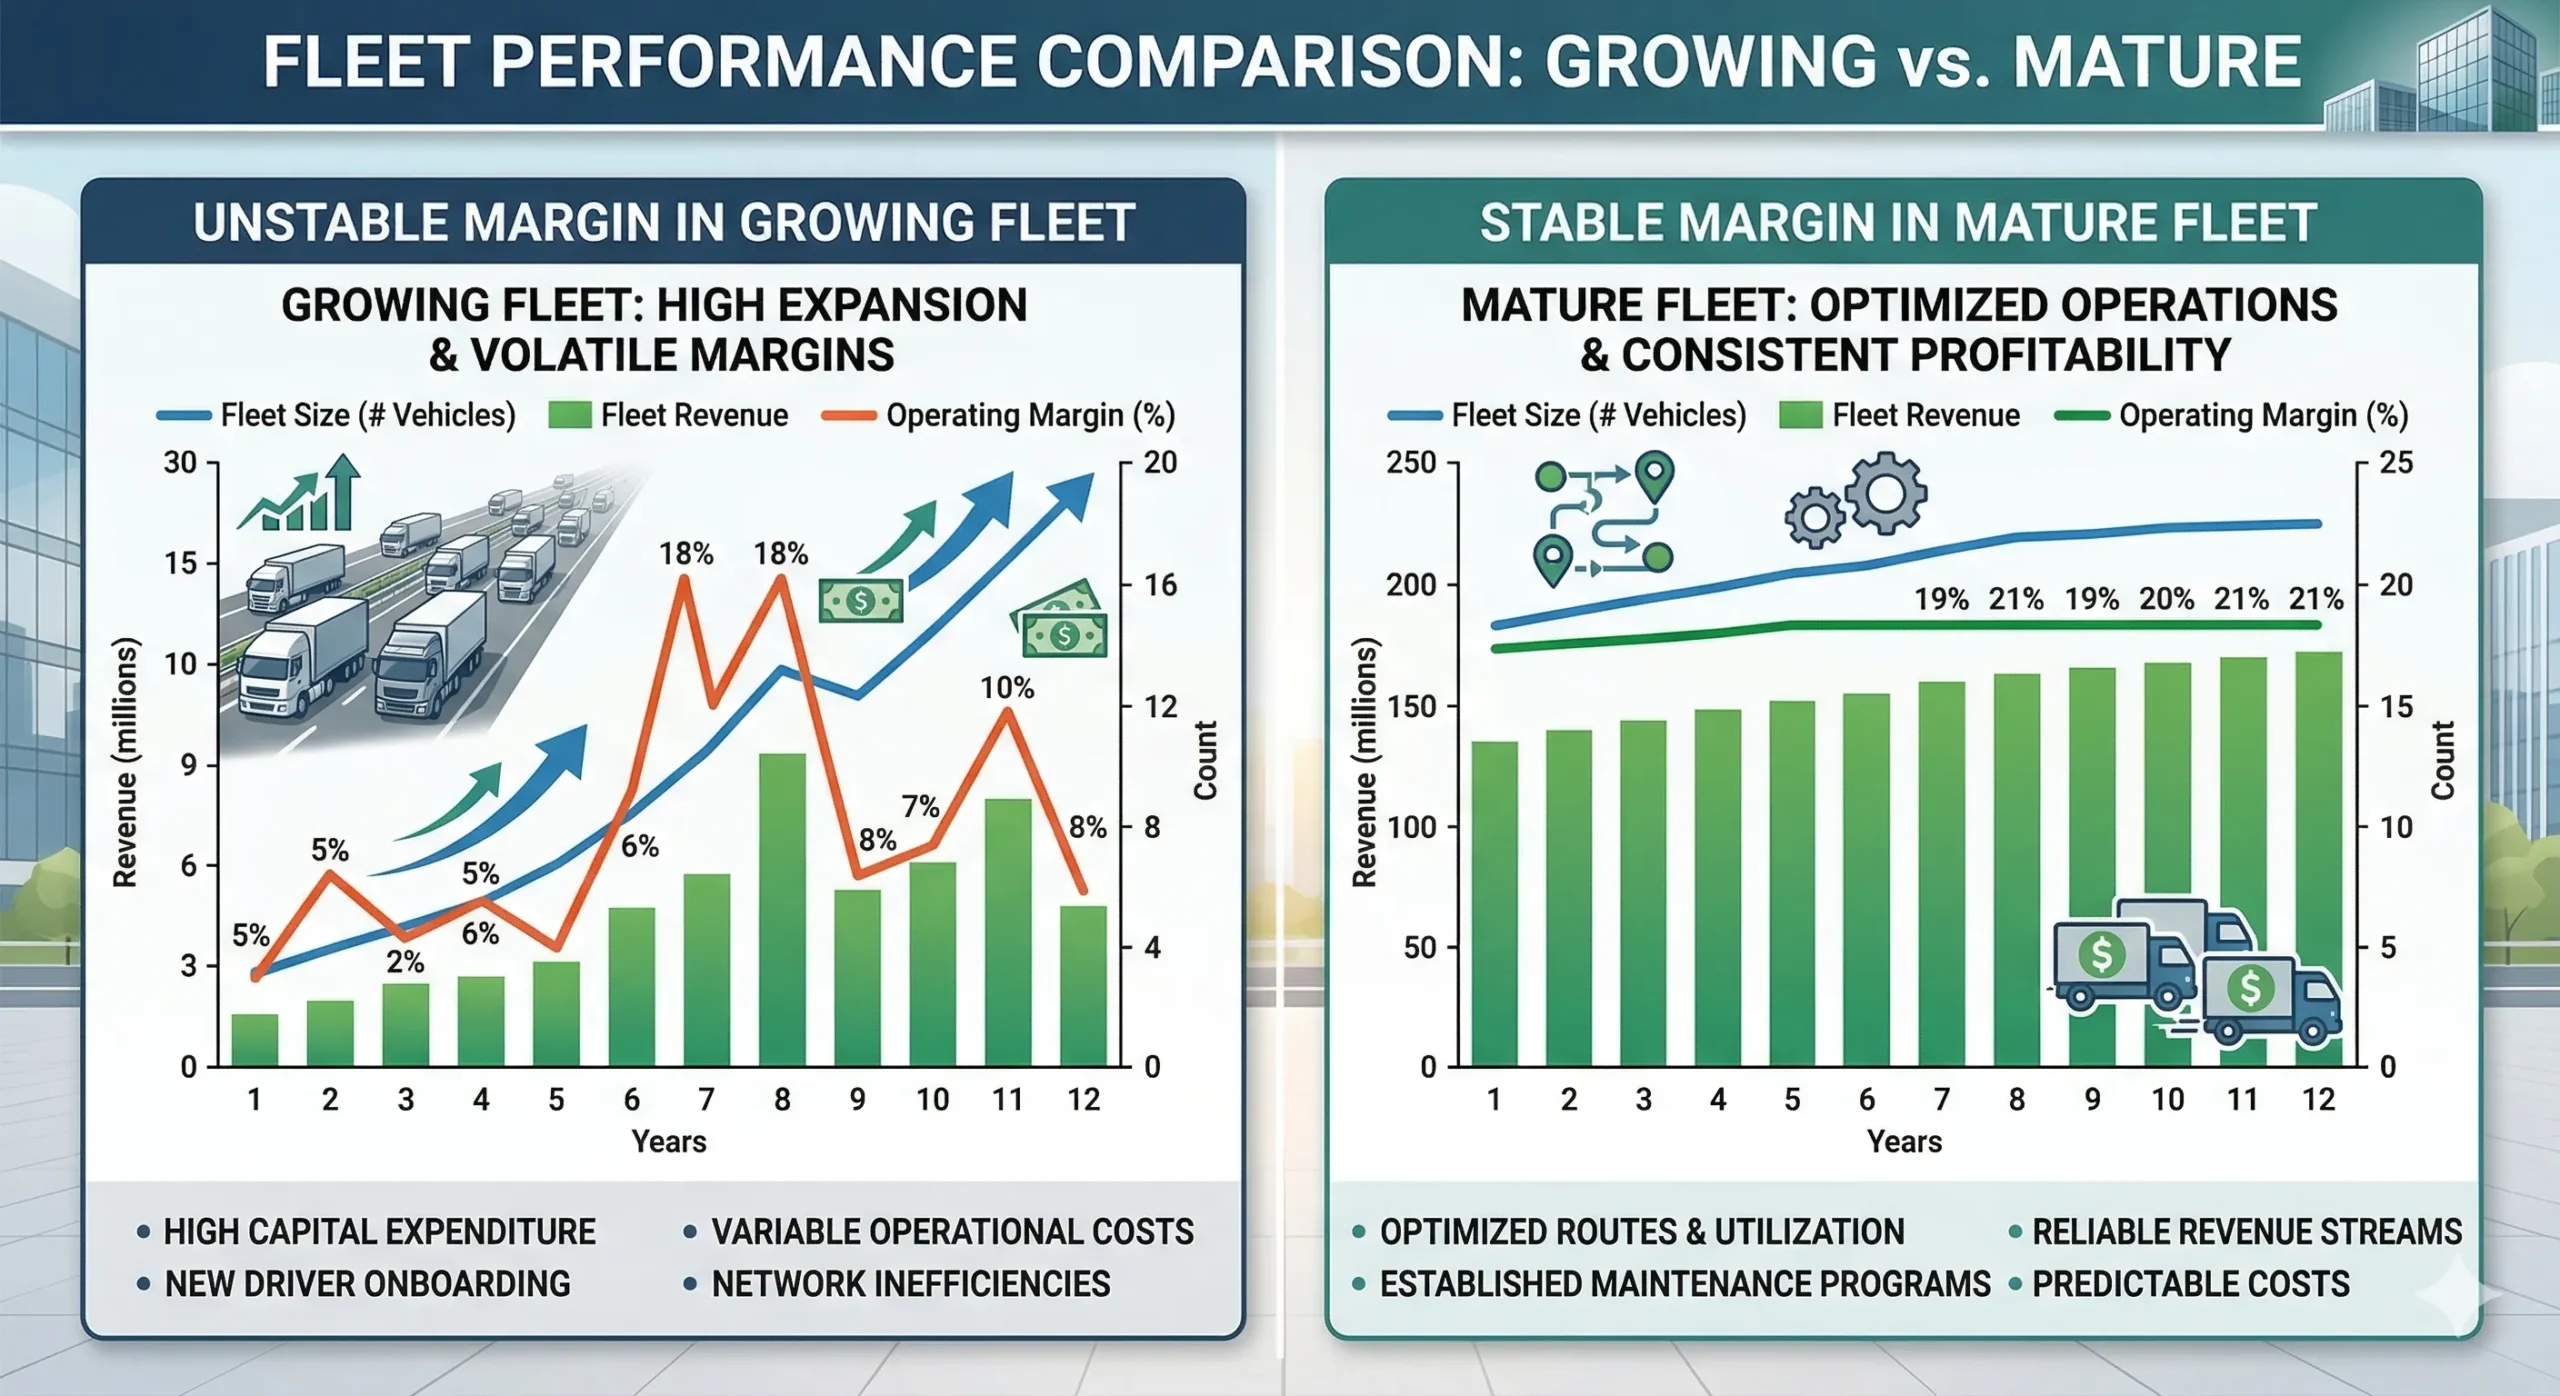
Growing fleets often focus on expanding their asset base. However, as size increases, coordination complexity surges. Without robust traffic allocation and intake discipline, vehicle utilization suffers. Rates per job may decline due to less selective booking, and time-on-road per vehicle drops as underutilized units accumulate. Consequently, RPV declines even as the total fleet grows—a structural drag on profitability.
In contrast, mature fleets engineer their intake processes and traffic allocation to optimize utilization. By dynamically assigning jobs according to asset suitability, they ensure each vehicle consistently delivers maximum value. Rate optimization becomes a science, not a scramble. As a result, RPV rises, and every additional vehicle compounds margin rather than diluting it.
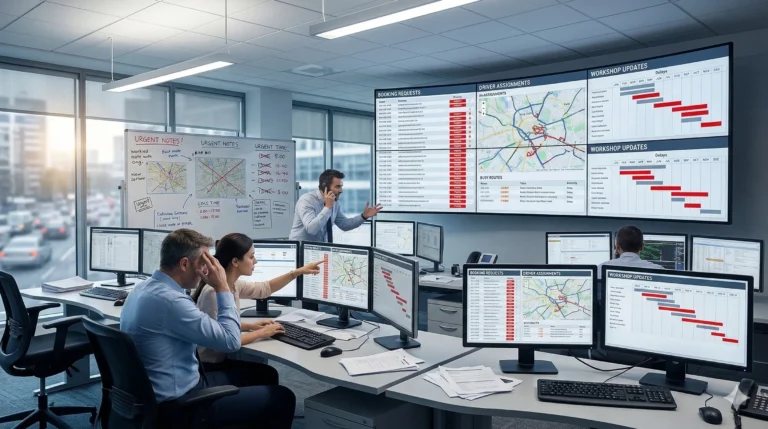
Cost Density vs Cost Stability
While growing fleets hire reactively to keep up with volume, mature fleets prioritize cost stability through automation and workflow standardization. The difference is stark:
Growing Fleets:
- Hire reactively, leading to onboarding inefficiencies
- Rely heavily on overtime as surprise breakdowns and spikes occur
- Suffer from coordination overload, increasing managerial overhead per asset
Mature Fleets:
- Automate intake and scheduling, reducing manual labor
- Stabilize headcount, enabling efficient training and knowledge retention
- Control cost per vehicle by embedding cost discipline into every workflow
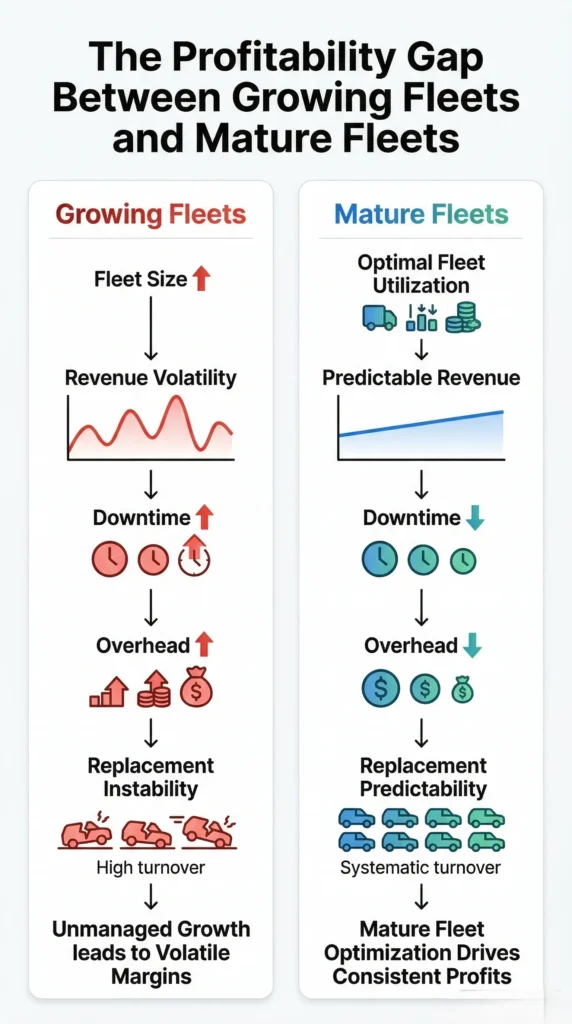
This distinction in cost control is not merely budgetary—it is structural. As fleets mature, cost-per-vehicle becomes highly predictable, enabling more accurate forecasting and reliable margin planning. Growing fleets, in contrast, endure wide cost swings and unpredictable expenses, eroding profitability as they scale.
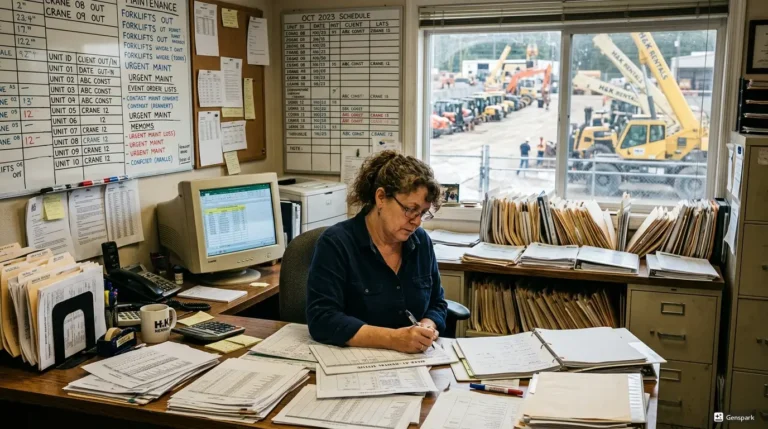
Downtime & Replacement Discipline
Downtime is the silent killer of fleet profitability. Growing fleets, lacking process maturity, often suffer from unpredictable repair cycles and inefficient replacement planning:
Growing Fleets:
- Face unpredictable repair cycles due to fragmented workshop management
- Struggle to retire or replace vehicles on time, leading to idle accumulation
- Experience compounding idle time, reducing available capacity while increasing fixed costs
Mature Fleets:
- Implement stage-based tracking across every workshop event, compressing downtime
- Forecast ready dates for vehicles, enabling proactive scheduling and customer commitments
- Monitor replacement ratios, ensuring assets are cycled out before reliability degrades
The result: Mature fleets keep assets moving, minimize idle inventory, and maintain a tight correlation between capacity and demand. Every hour a vehicle sits idle or in unscheduled repair compresses gross margin; operational discipline in downtime and replacement is non-negotiable for profitability.
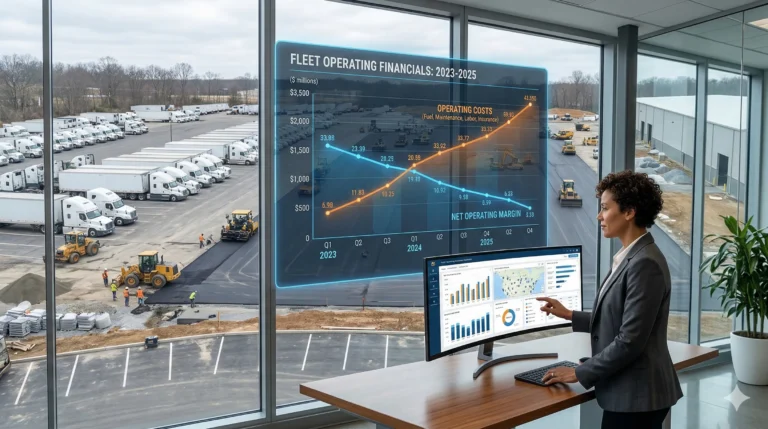
Financial Visibility & Margin Predictability
Growing fleets often track only top-line revenue, ignoring granular per-asset profitability. This myopia masks underperforming vehicles and fails to reveal cost leaks:
Growing Fleets:
- Monitor total revenue but neglect RPV trending and asset-level contribution
- Miss the true cost of unplanned repairs or downtime per vehicle
- Lack margin visibility, making it impossible to course-correct operationally
Mature Fleets:
- Track RPV daily, surfacing trends and outliers in real time
- Log costs per repair cycle at the asset level, exposing inefficiency instantly
- View margin per asset, allowing for surgical intervention and performance optimization
Such granular financial visibility transforms the business. Instead of reacting to lagging indicators, mature fleets predict margin performance and act before profitability erodes.
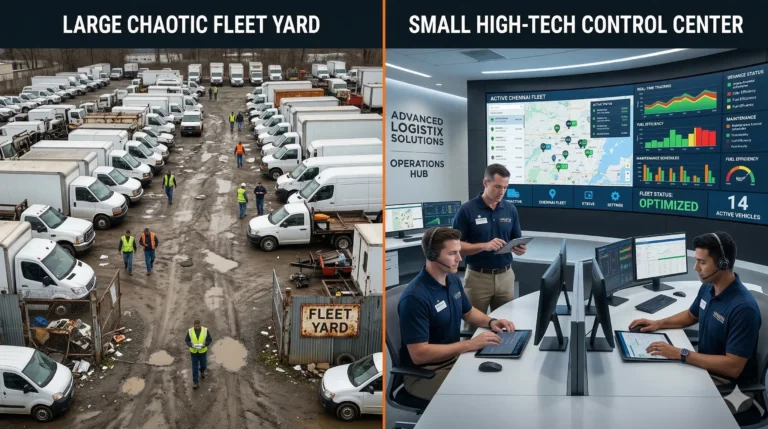
Structural Synchronization as Profit Engine
The true engine of margin density is not fleet size but synchronized operations. A mature operational framework integrates:
Automated Intake → Live Allocation → Workshop Tracking → Replacement Forecasting → Real-Time Cost Logging → Unified Dashboard
Each stage feeds actionable data forward, enabling real-time decisions and continuous improvement. Automated intake ensures only high-value jobs enter the pipeline. Live allocation maximizes asset utilization. Workshop tracking compresses downtime and flags repair bottlenecks. Replacement forecasting ensures capital is deployed efficiently. Real-time logging exposes cost spikes instantly. A unified dashboard turns raw data into executive insight.
This orchestration transforms coordination from a pain point into a profit engine. As a result, mature fleets achieve a level of financial stability and predictability unattainable for those stuck in reactive, fragmented operations.
FAQ: The Profitability Gap Between Growing Fleets and Mature Fleets
The gap results from operational maturity. Growing fleets expand capacity but struggle to coordinate, leading to falling revenue per vehicle and unstable costs. Mature fleets synchronize intake, allocation, repair, and replacement, maximizing RPV and cost stability.
As fleets grow quickly, coordination strain leads to underutilized vehicles, lower rates, and less time-on-road per asset. Without robust intake and allocation systems, added capacity dilutes revenue per vehicle.
They automate workflows, monitor asset-level margins daily, and forecast costs and replacement needs. This reduces operational surprises and compresses cost variability, making margins predictable.
Extended or unpredictable downtime reduces revenue opportunities and increases fixed costs per asset. Mature fleets use stage-based tracking and ready-date forecasting to minimize idle time and keep the fleet productive.
No. Without operational synchronization, adding vehicles often dilutes revenue and increases cost volatility. Only mature operational design translates scale into profit.
Conclusion
The profitability gap between growing fleets and mature fleets reflects operational discipline. Growing fleets expand capacity. Mature fleets expand margin density.
Maturity creates predictable profit.