Introduction
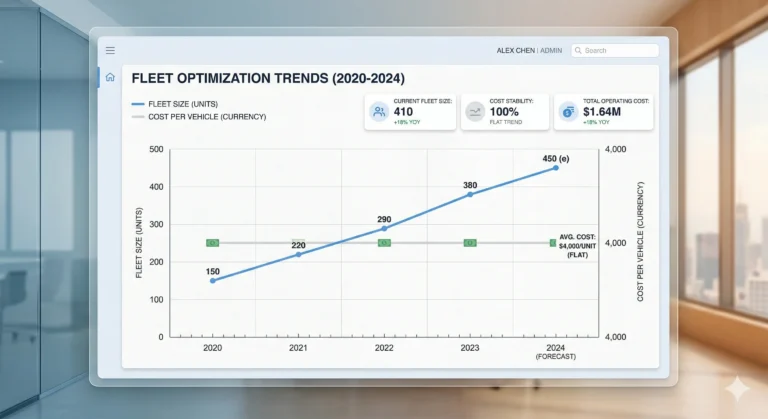
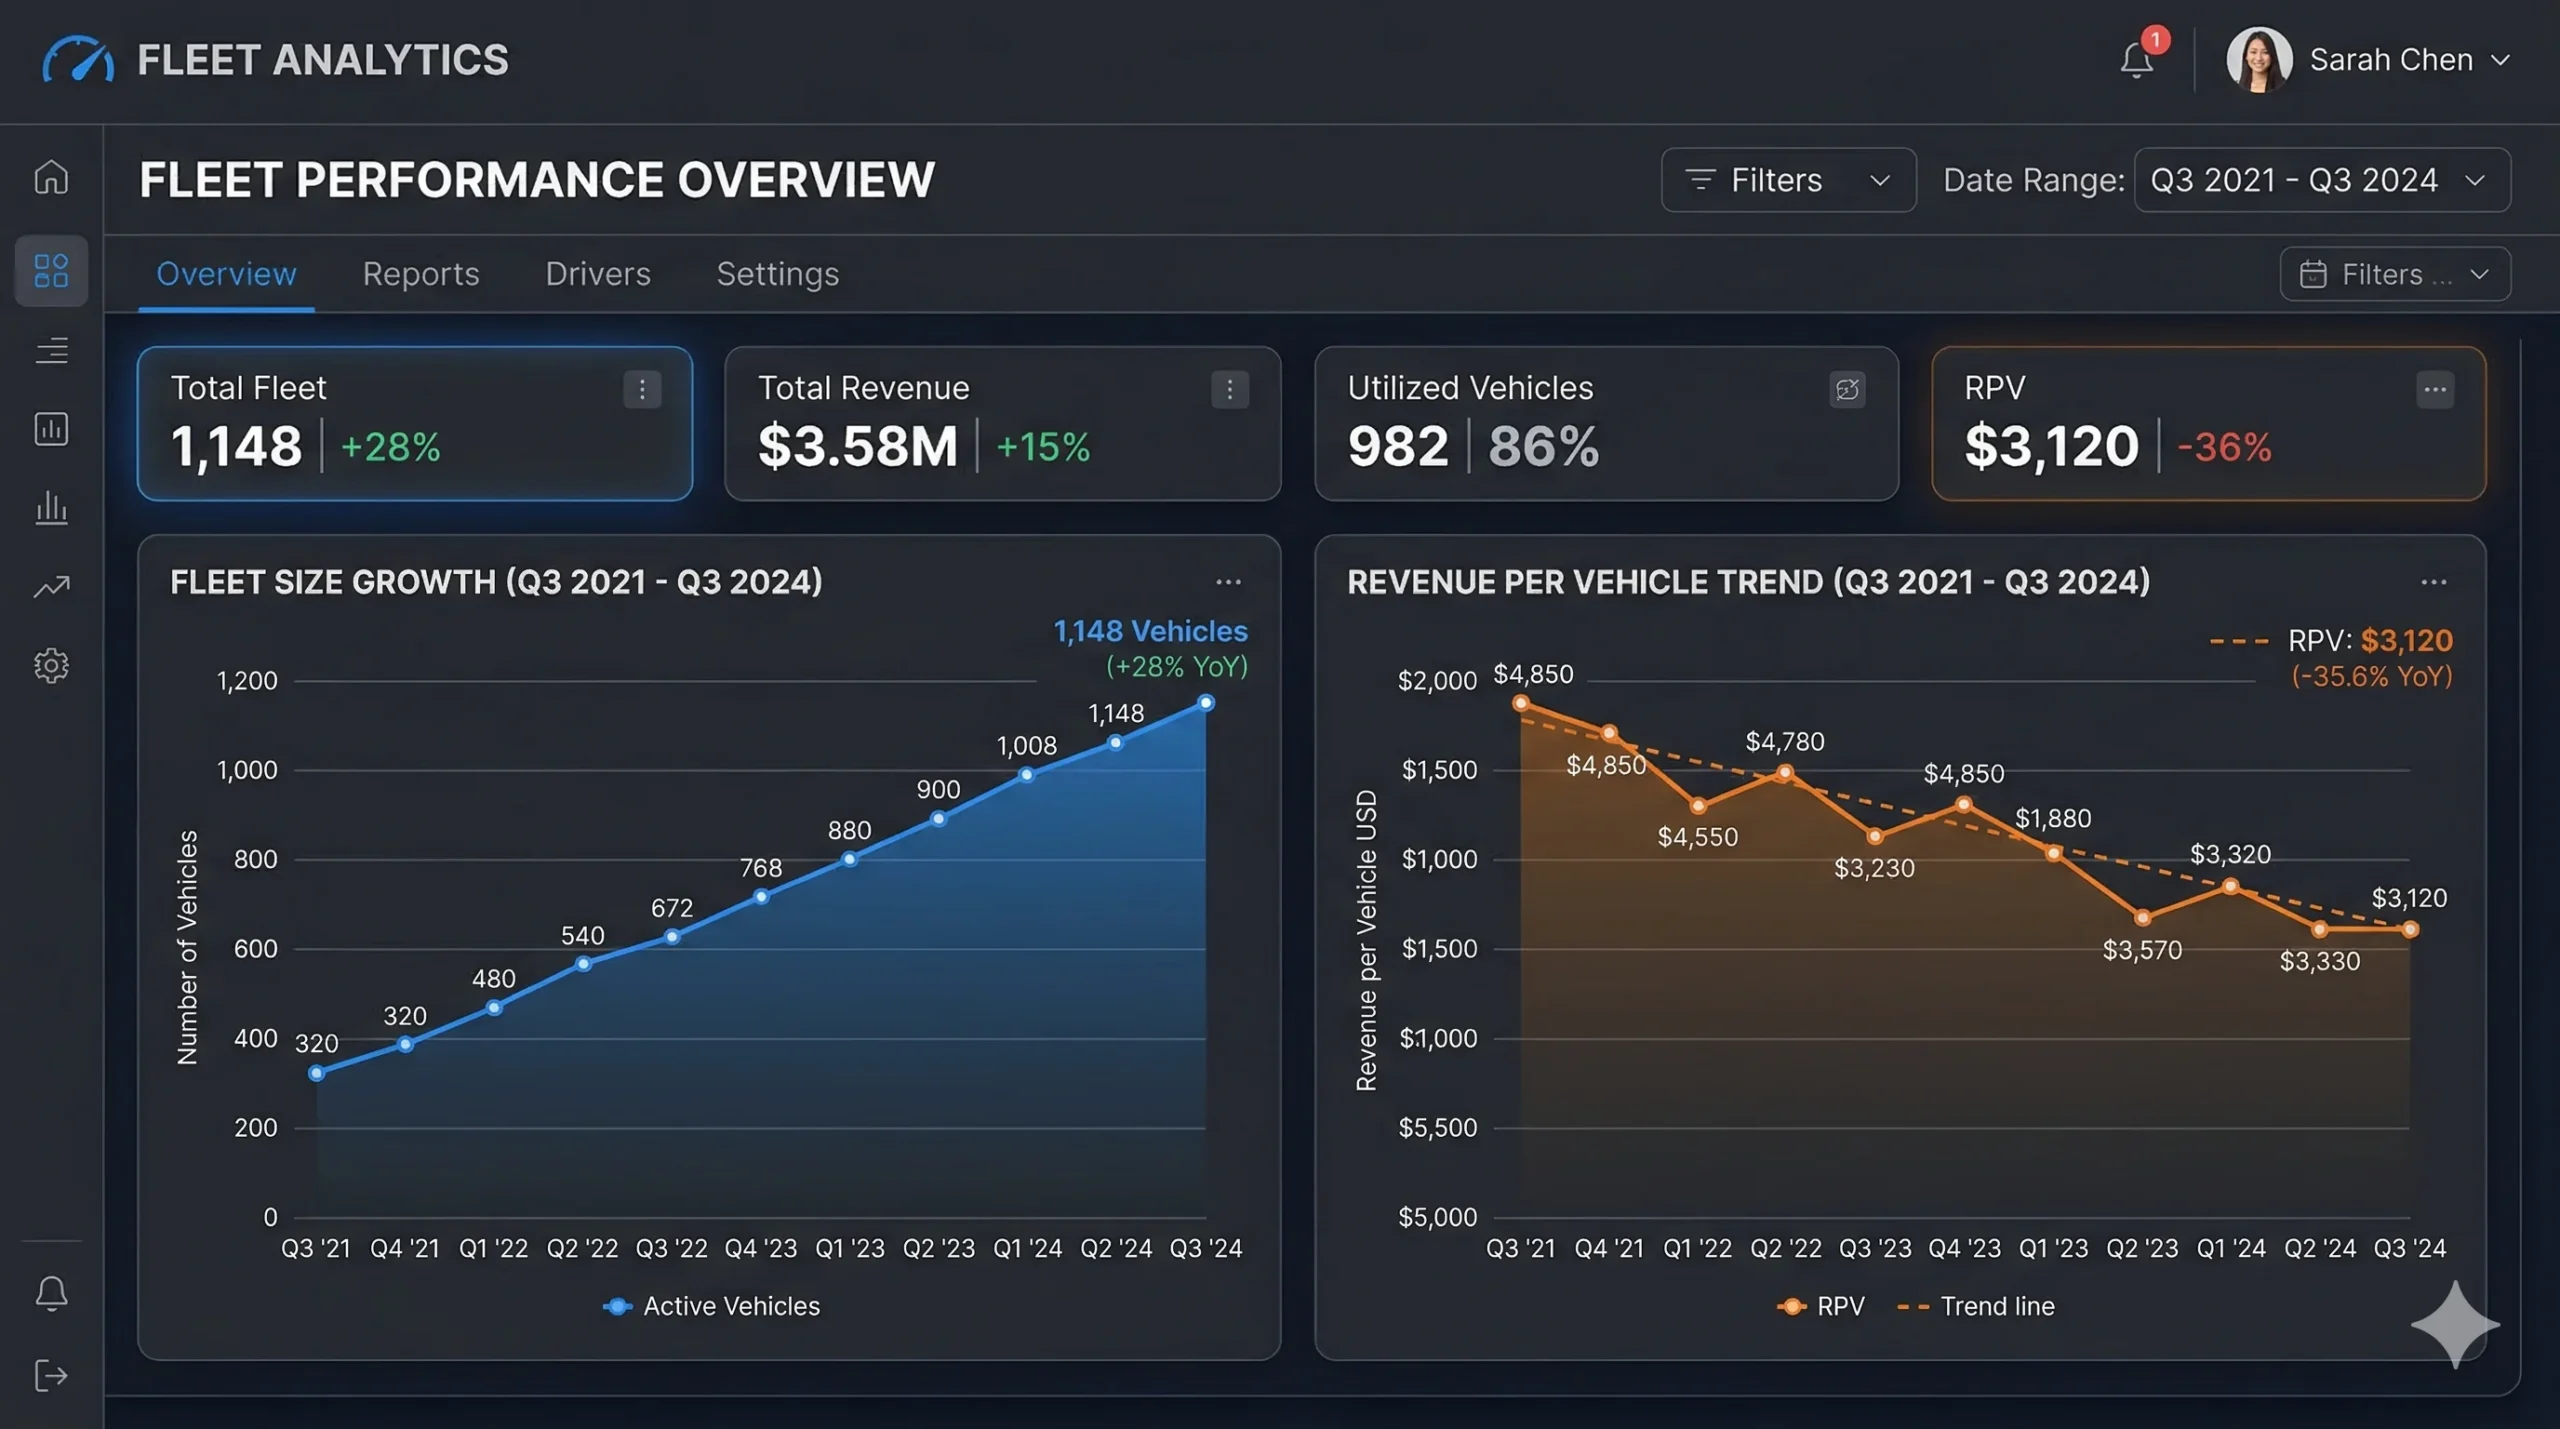
Poor operational design reduces revenue per vehicle during growth because expansion increases coordination density while inefficiencies remain uncorrected. As fleet size expands, structural weaknesses amplify, and revenue per asset declines quietly. Even as total revenue climbs, per-vehicle profitability often erodes, undermining both near-term targets and long-term enterprise value. Crucially, growing a fleet does not guarantee growing revenue per vehicle—a critical distinction for every executive in high-velocity rental and mobility businesses.
Revenue Per Vehicle Is the Real Performance Metric
Revenue Per Vehicle (RPV) is the gold standard for operational assessment in fleet-based businesses. It is calculated simply:
Revenue Per Vehicle = Utilization × Rate × Time
While expansion efforts typically prioritize increasing the number of vehicles, they often neglect the core drivers of RPV. As fleets grow, utilization rates become erratic, average daily rates face margin pressure, and downtime quietly expands. This means that growth, if poorly managed, can actually dilute the earning power of each asset. In performance-driven operations, maximizing RPV—not just adding units—must remain the focus.
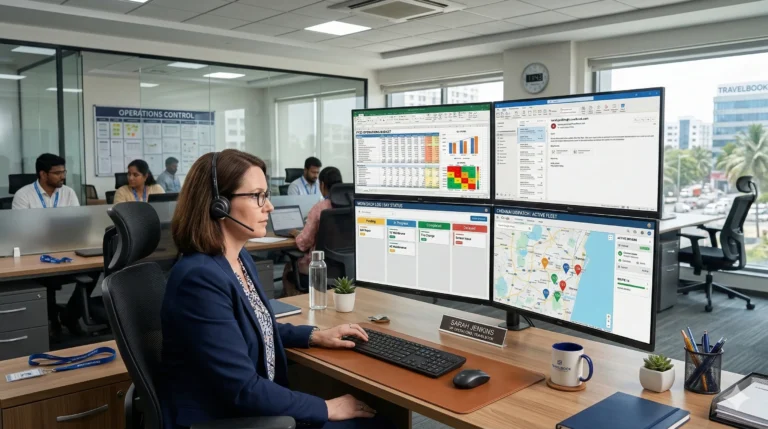
Intake & Routing Friction Reduces Utilization
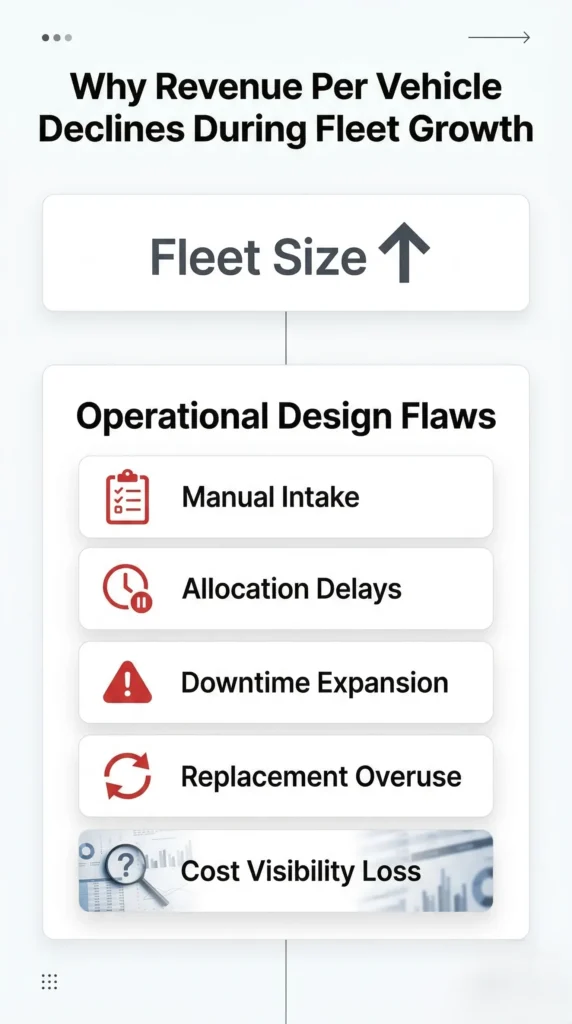
One of the earliest points where poor operational design reduces revenue per vehicle during growth is the intake and routing process. As fleets scale, manual intake procedures often become bottlenecks. Vehicles wait for assignment while paperwork, verification, or manual data entry delay their availability. These delays are compounded by urgency misclassification—where critical requests are deprioritized or low-priority issues escalate unnecessarily, resulting in inefficient resource allocation.
Escalation loops, where decisions or exceptions must be repeatedly reviewed, further slow the process. Instead of rapid triage, vehicles accumulate in staging areas, waiting for clarity. Allocation bottlenecks—caused by lack of automation or unclear routing rules—multiply as the fleet grows. The result? Latency at intake directly reduces billable time, compressing utilization windows and immediately impacting RPV. Every hour lost at intake translates to revenue left on the table.
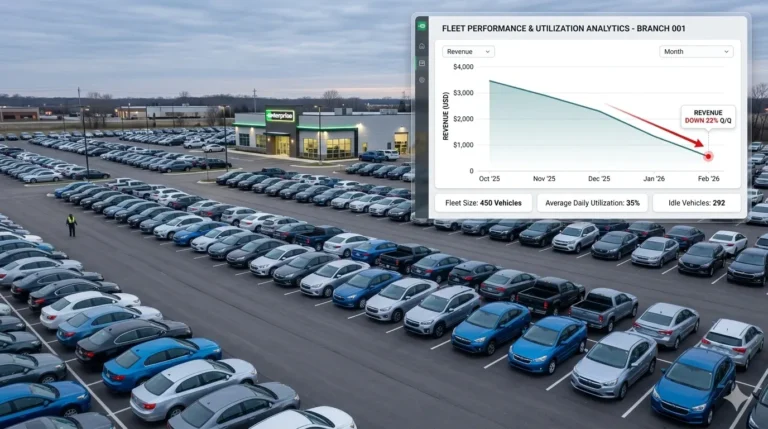
Allocation Gaps Create Hidden Idle Time
As the fleet expands, allocation complexity increases exponentially. Poor operational visibility leads to double bookings—two clients assigned the same vehicle or asset, resulting in confusion and downtime while the issue is resolved. Meanwhile, limited visibility prevents proactive scheduling, causing vehicles to sit idle between bookings or after maintenance.
Replacement conflicts arise when vehicles needed for urgent replacement are not available due to poor planning, further increasing idle time. Geographic imbalance—where vehicles are concentrated in low-demand zones while high-demand areas face shortages—worsens as allocation oversight lags behind fleet growth. These allocation gaps create hidden idle days, which multiply rapidly during expansion. Each idle day represents a direct loss in revenue per vehicle, silently eroding margin.
Workshop & Downtime Instability Erode Revenue
Inefficient workshop management is a primary driver of RPV decline during scaling. Ambiguity in repair stages—where it is unclear whether a vehicle is awaiting diagnosis, parts, or approval—slows progress. Approval lag, often due to manual sign-offs or unclear escalation paths, further extends downtime.
Overreliance on replacements instead of efficient repairs leads to unnecessary asset cycling, increasing operational costs and reducing fleet stability. Ready-date unpredictability—when return-to-service timelines shift without warning—disrupts allocation planning and reduces confidence in workshop output. The cumulative effect is predictable: downtime multiplies, utilization drops, and RPV falls. Every day a vehicle spends in the workshop is a day it cannot generate revenue, tying up capital and distorting performance metrics.
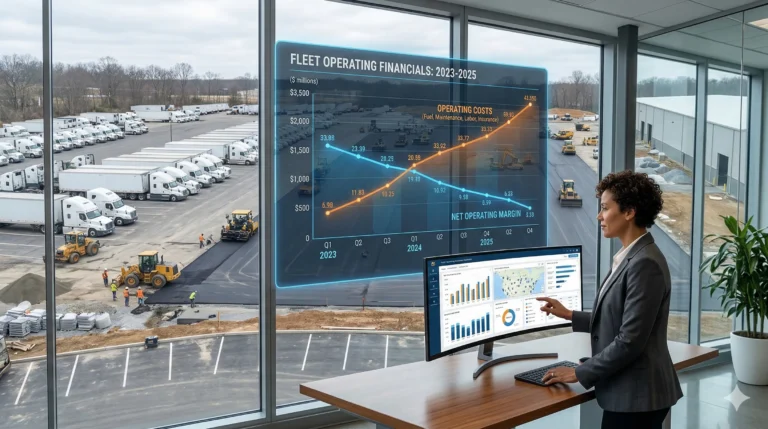
Financial Blind Spots Mask Declining RPV
Even as operational inefficiencies compound, many organizations remain unaware of per-vehicle revenue erosion due to financial blind spots. Without real-time RPV tracking, decision-makers rely on aggregate revenue numbers, missing the slow decline at the unit level. Delayed cost logging—where expenses are recorded days or weeks after they occur—prevents timely margin analysis.
As a result, margin per asset remains unknown, and expansion decisions are often based on total revenue, not per-vehicle profitability. This lack of financial visibility allows structural decline to continue unchecked. By the time performance issues surface in quarterly reviews, significant value may have already been lost.
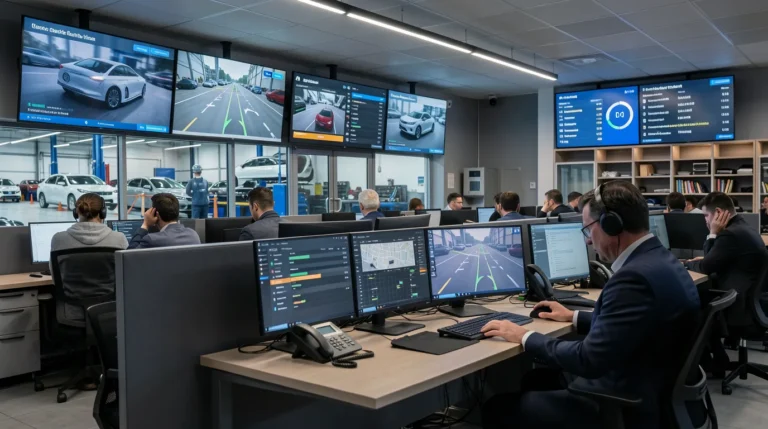
Structural Redesign Protects Revenue Per Vehicle
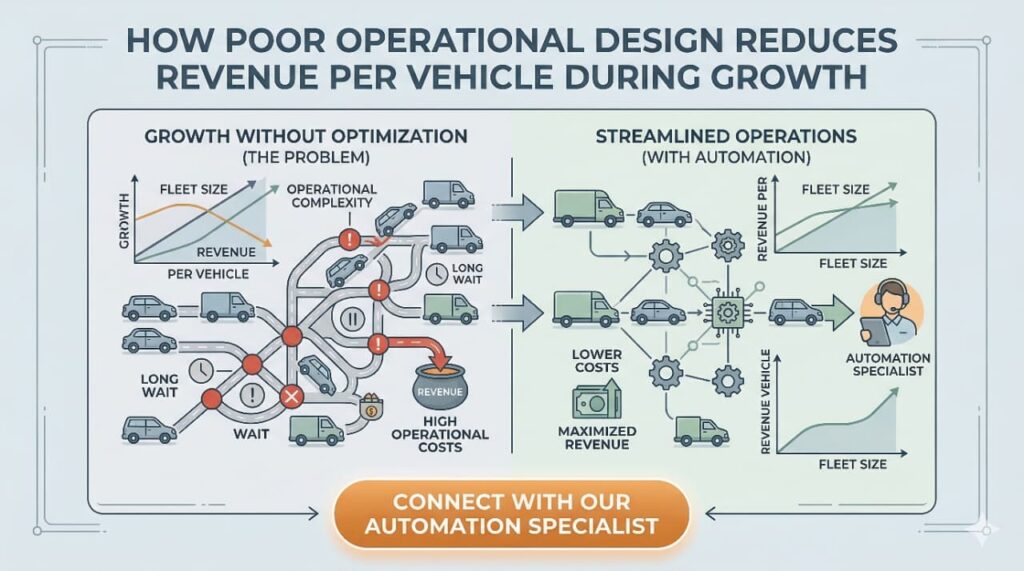
To counteract these threats, high-performing fleets implement structural redesigns that protect RPV during growth. Automated intake systems accelerate processing and eliminate manual delays. Live allocation visibility ensures that every vehicle is tracked in real time, preventing double bookings and optimizing geographic distribution.
Workshop lifecycle control—powered by digital workflows and automated status updates—reduces ambiguity and approval lag. Replacement forecasting leverages predictive analytics to minimize unnecessary cycling and ensure asset readiness. Finally, real-time profitability dashboards provide executives with up-to-the-minute RPV, margin, and utilization data, enabling proactive interventions.
Centralized dashboard control is the linchpin. By unifying intake, allocation, workshop, replacement, and financial data in one interface, organizations can stabilize RPV, anticipate disruptions, and scale with confidence.
FAQ: Protecting Revenue Per Vehicle During Growth
Revenue per vehicle (RPV) measures the average income generated by each asset over a set period. It is a direct indicator of operational efficiency and asset productivity.
As fleets grow, coordination becomes more complex and inefficiencies multiply. Without redesign, bottlenecks and downtime increase, reducing utilization and RPV.
Downtime removes vehicles from active service, reducing billable days and directly lowering RPV. The longer a vehicle is unavailable, the less revenue it generates.
Manual intake, poor allocation visibility, workflow ambiguity, and delayed financial tracking all suppress utilization and, by extension, RPV.
Implementing automation, live tracking, predictive maintenance, and real-time profitability dashboards ensures that inefficiencies are addressed before they erode RPV.
Conclusion
Fleet growth increases capacity, but poor operational design reduces revenue per vehicle during growth by amplifying inefficiencies. Without structural improvements, scaling leads to utilization instability, downtime multiplication, and financial blind spots—all of which erode asset-level profitability. Companies that redesign workflows before expansion stabilize utilization and protect profitability.